
The latest quarterly immigration statistics show that immigration to the UK for the year ended June 2016 was 650,000, the highest level ever recorded. Net migration stood at 335,000, just below the previous high of 2015. An estimated 49,000 more British citizens left the UK than returned from abroad.
You can see the summaries and breakdowns by theme here and the ONS analysis here. This useful chart from the ONS shows the overall trends, where we can see increasing work related migration over time, a sharp fall in studuents and everything else holding broadly steady:
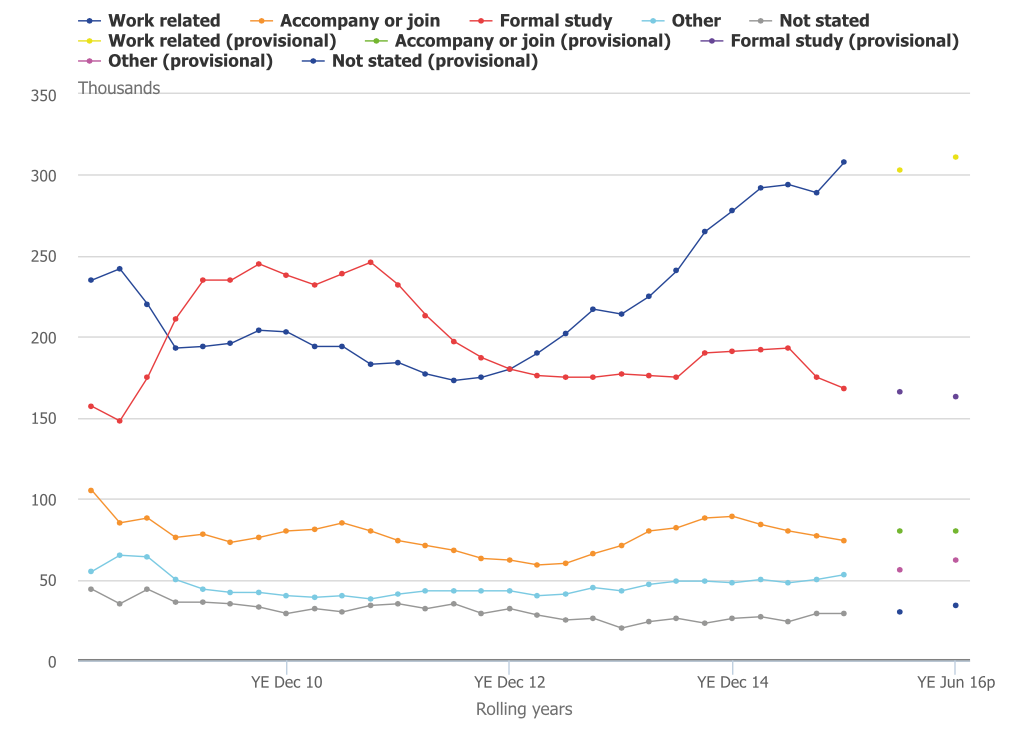
It would be fair to say that international migration is not falling and is certainly nowhere near Theresa May’s self inflicted net migration target of “tens of thousands”. This is, of course, a Good Thing for the British economy and our collective prosperity. It also reflects well on how open and welcoming our society has been.
Immigration stats reported, as ever, like a disaster. They are a testament to the success of multicultural Britain https://t.co/AoEk0oq3zs
— Ian Dunt (@IanDunt) December 1, 2016
Sunder Katwala at British Futures has suggested it is time to move on from our collective obsession with the failed targets of the past and instead move on to consider what kind of future immigration policy we want following Brexit. He is surely right.
In the meantime, some highlights from the various sets of statistics…
Asylum
The total number of asylum applications increased by 14% to 22,380. The top five countries of origin were Iran, Iraq, Pakistan, Afghanistan and Syria. It is interesting to see the number of Eritreans claiming asylum seems to have dropped.
A total of 4,414 people have now been given sanctuary in the UK under the Syrian Vulnerable Persons Resettlement Sceheme and a further 715 people under the Gateway Protection Programme and Mandate Scheme.
There was a 21% increase in refugee family reunion applications and a welcome 40% increase in the total number of grants (see family set of statistics).
EU applications
Information on EU residence documents applications is included in the family section of the statistics. These statistics cover the year to September 2016. There had been a 67% rise in the number of decisions on EU residence documents and there was a sharp increase in applications from EU nationals.
In the quarters before and after the Brexit vote, there was an increase of 44% in the number of permanent residence applications, from 10,069 (already a record high at that time) to 14,472. Of that number, 11,281 were EU nationals. If the numbers of EU nationals applying for permanent residence remained at around 12,000 per quarter it would take 75 years for all the EU nationals currently in the UK to apply.
The number of permanent residence documents issued more than doubled compared to the previous year and the success rate for permanent residence applications was still running at a steady 75% once invalid applications were excluded.
There was a 2% increase in citizenship applications by EU nationals.
Alan Travis of The Guardian is reporting a growing backlog. I could not see this in the reports or data tables and I think his source was a Home Office spokesman:
Backlog of EU citizens in UK trying to secure British residency status jumped from 91,000 to 113,272 post Brexit in September – Home Office
— Alan Travis (@alantravis40) December 1, 2016
Work and study
The numbers of Tier 2 skilled visas increased 1% to 94,000 but Tier 1 visas fell 34% overall and Tier 5 visas fell 7%. Of the 94,000 Tier 2 visas issued, 57% were issued to Indian nationals.
The total number of study visas fell 3% and the number of university student visas fell a further 1%, continuing a year on year decline. There was a 6% increase in Russell Group visas, though.
Family
The total number of family related visas issued fell 2%. This overall figure seems to mask variations between different route, though, with a 2% increase in partner applications, a 9% fall in children applications and a surprising 34% increase in “other dependants”. This must include Adult Dependant Relatives but may also include other categories.
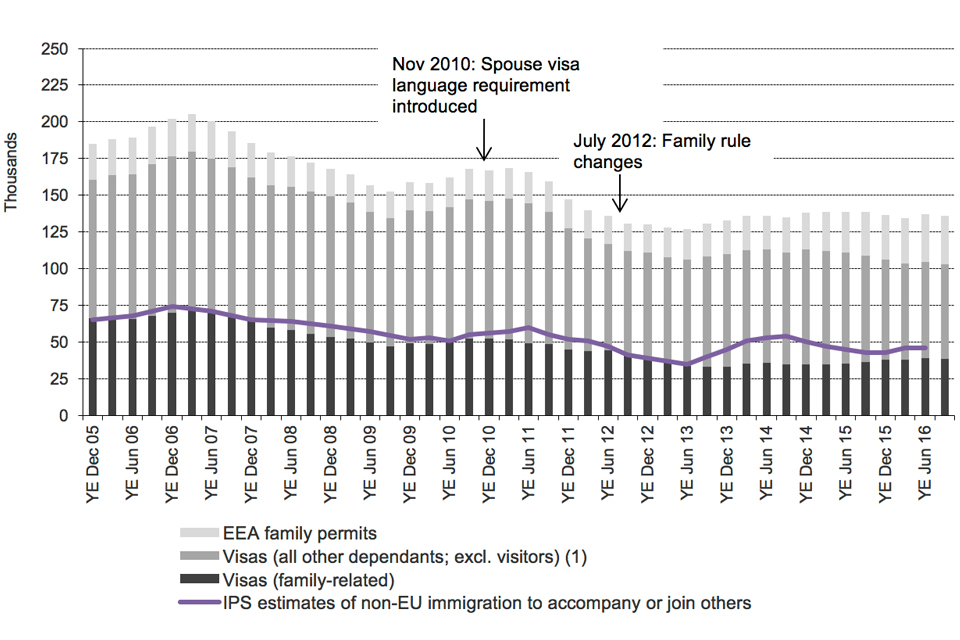
The number of grants of settlement for family related reasons fell by a huge 67%.This included a 69% fall of 13,357 in grants to partners, a 52% fall of 1,527 in grants to children, a 70% fall of 57 in grants to parents and grandparents. As the summary suggests, this may be due to the extension in 2012 of the time it takes to qualify for settlement.
The long term trends are shown in this chart:
Enforcement
The number of enforced removals fell once agin, this time by 9%, as did the number of recorded voluntary departures. A total of 5,825 foreign national offenders were removed or deported in the year.
The number of people entering detention also fell by 9%, which is very welcome. However, the number of people who are detained but then released again within the UK rather than removed (which is supposed to be the point of immigration detention) is still very high, at 43%.
203 detainees had been in detention for between 1 and 2 years and 37 detainees for longer than 2 years.
And a final sad note on which to end: 93 children were detained in the year ended September 2016.