- BY CJ McKinney

Latest immigration stats: EU residence document applications back on the rise
THANKS FOR READING
Older content is locked

A great deal of time and effort goes into producing the information on Free Movement, become a member of Free Movement to get unlimited access to all articles, and much, much more
TAKE FREE MOVEMENT FURTHER
By becoming a member of Free Movement, you not only support the hard-work that goes into maintaining the website, but get access to premium features;
- Single login for personal use
- FREE downloads of Free Movement ebooks
- Access to all Free Movement blog content
- Access to all our online training materials
- Access to our busy forums
- Downloadable CPD certificates
Table of Contents
ToggleThis is a collection of statistics on the UK immigration system. The Office for National Statistics, Home Office and Courts & Tribunals Service publish regular quarterly data on the number of migrants coming to the UK, how immigration applications are processed and how appeals are disposed of. We use these to regularly update the information contained below.
Brexit
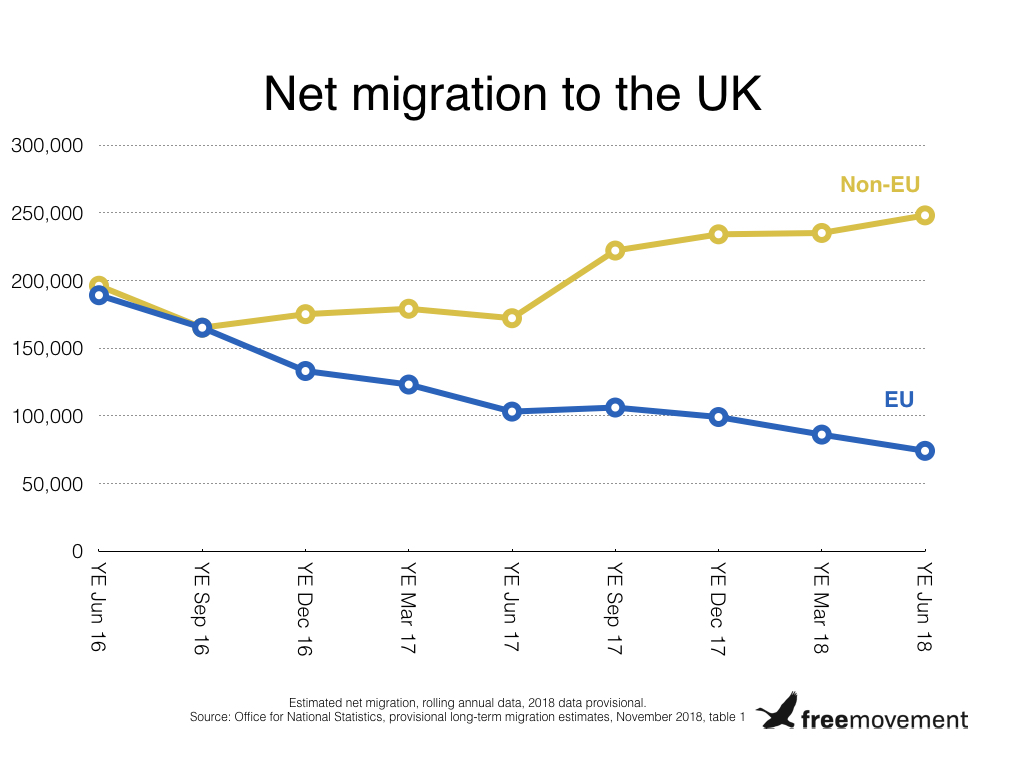
Net migration is the number of immigrants coming to live in the UK minus the number of emigrants. There are well-known problems with the estimates used to calculate net migration in between censuses, so the figures are not exact. The latest estimate is that overall net migration to the UK was 273,000 over the last 12 months.
Within that, there has been a considerable drop in net migration from the EU since the Brexit referendum, with more European migrants leaving and fewer arriving. That has been offset by a rise in non-EU migration, meaning that overall the numbers are fairly steady over the past couple of years.
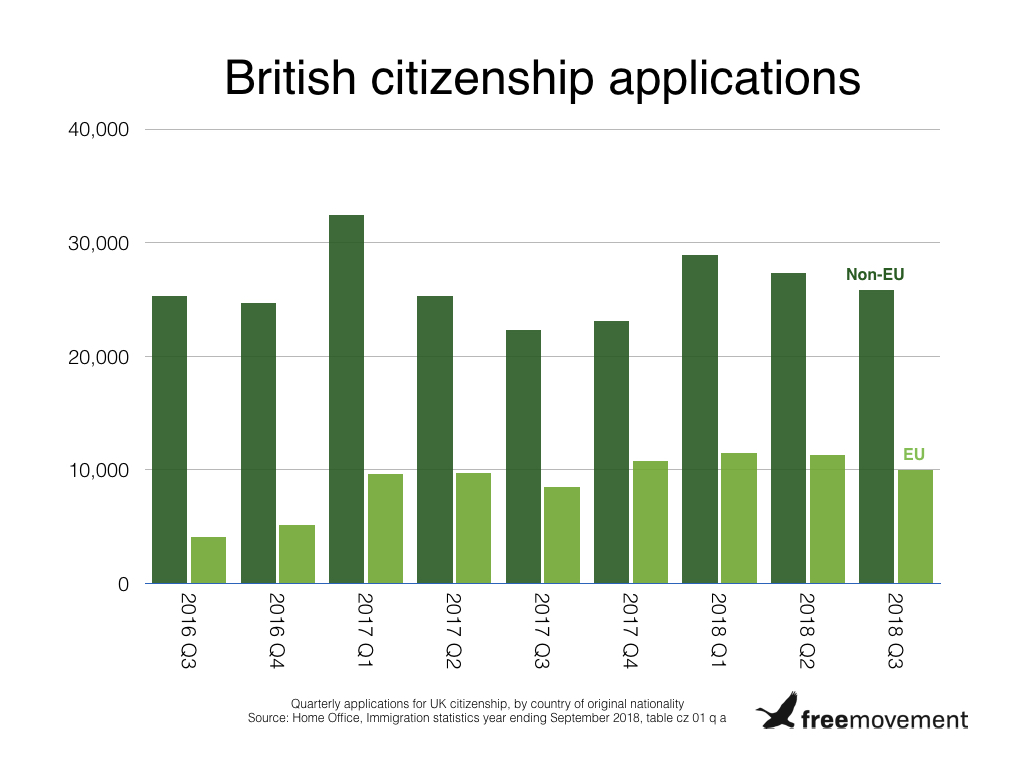
EU citizens who plan to stay are increasingly applying for British citizenship, rightly perceived as offering the most security in terms of the right to live in the UK. In the first half of 2018, UK citizenship applications from EU nationals were at record levels, although they have fallen back a little over the summer. Still, EU nationals accounted for 28% of all applications for British nationality in the third quarter of 2018, up from 14% two years ago.
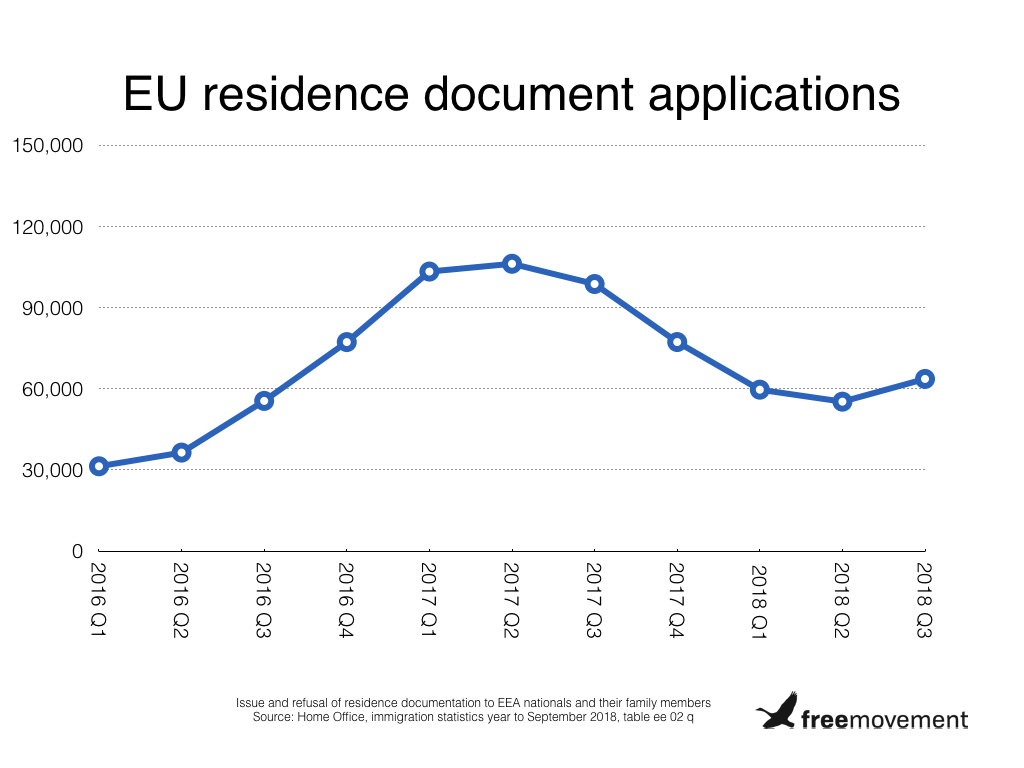
Under EU law, having a right to reside or the right to permanent residence is not dependent on making an application: the right exists independent of any documentary proof. Brexit has caused many more people to apply for documents for peace of mind. That trend is now returning to normal as people await the new Settlement Scheme that promises a much easier way of proving immigration status.
Ironically, though, the number of people applying has risen again in Q3 2018 — just as the Settlement Scheme is starting up. There is considerable distrust among EU citizens that the Home Office will deliver on its commitments to them.
Asylum
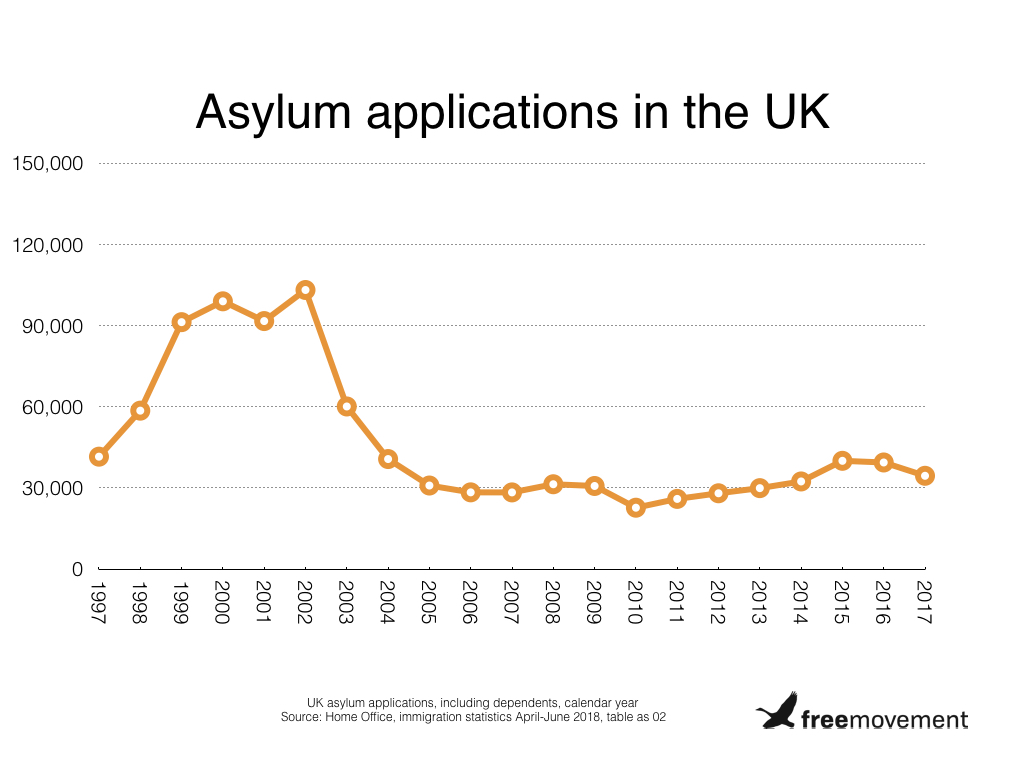
The number of people seeking asylum in the UK is at a historically low level. Around 34,000 people applied for asylum in the UK in 2017, including dependent family members. That’s a 15% drop on the previous year and “reflects a return to levels seen before the European migration crisis in 2015”, as the Home Office puts it.
It represents an even steeper decline from the turn of the century, when applications were running at around 100,000 per year.
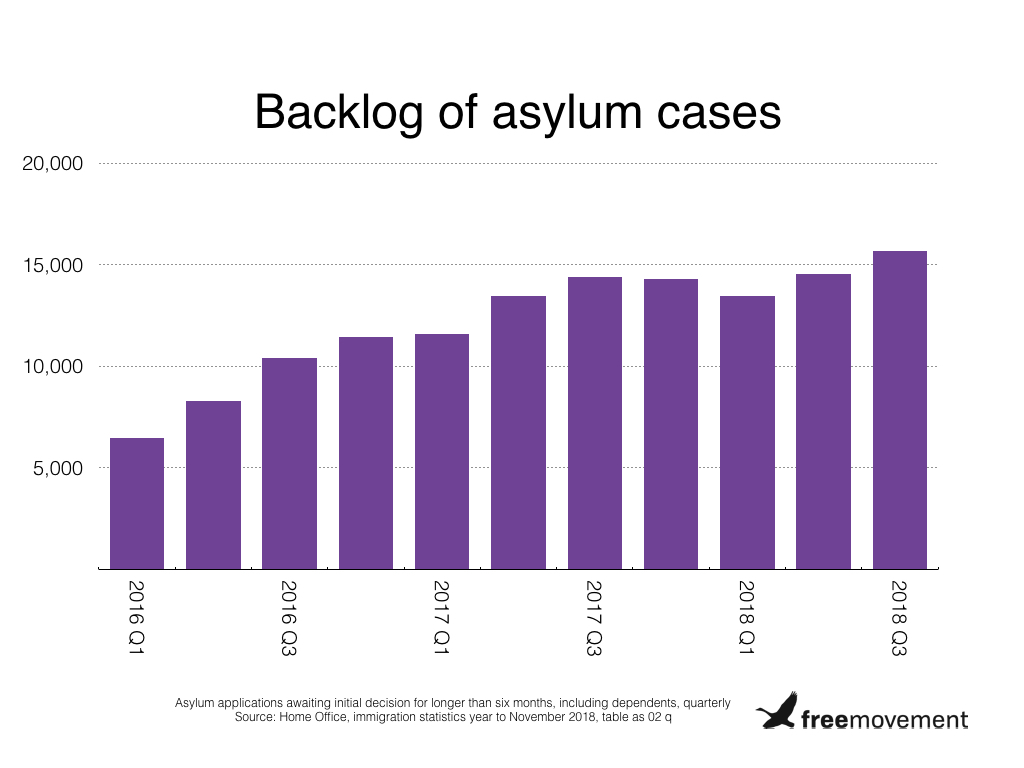
The Home Office, which makes the initial decision on whether a person qualifies for asylum, has an internal target of deciding “straightforward” cases within six months. The number of cases waiting longer than six months has more than tripled, from around 5,000 in the third quarter of 2015 to almost 16,000 in the last quarter.
More Syrians get asylum in the UK than any other nationality. The table below shows the top ten nationalities granted asylum in the UK in the most recent quarter, either following a positive Home Office decision on their application or after being resettled from a conflict zone.
| Nationality | Asylum grants + resettlements |
| Syria | 1,273 |
| Iran | 365 |
| Libya | 290 |
| Iraq | 272 |
| Sudan | 226 |
| Afghanistan | 225 |
| Eritrea | 205 |
| Congo | 143 |
| Pakistan | 128 |
| Somalia | 116 |
| Source: Home Office, immigration statistics year to September 2018, tables as 02 q & as 19 q | |
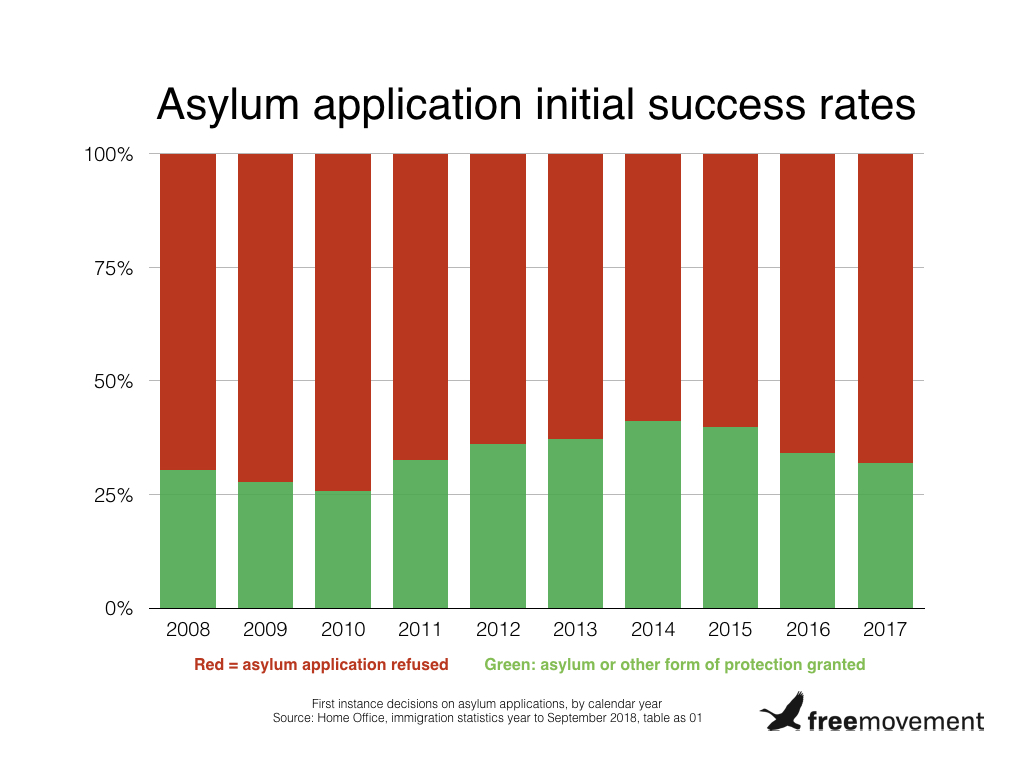
Around two thirds of asylum seekers will have their bid to be recognised as a refugee turned down the Home Office at the first time of asking. The chart below shows the “first instance” success rate of asylum applications, before any appeal.
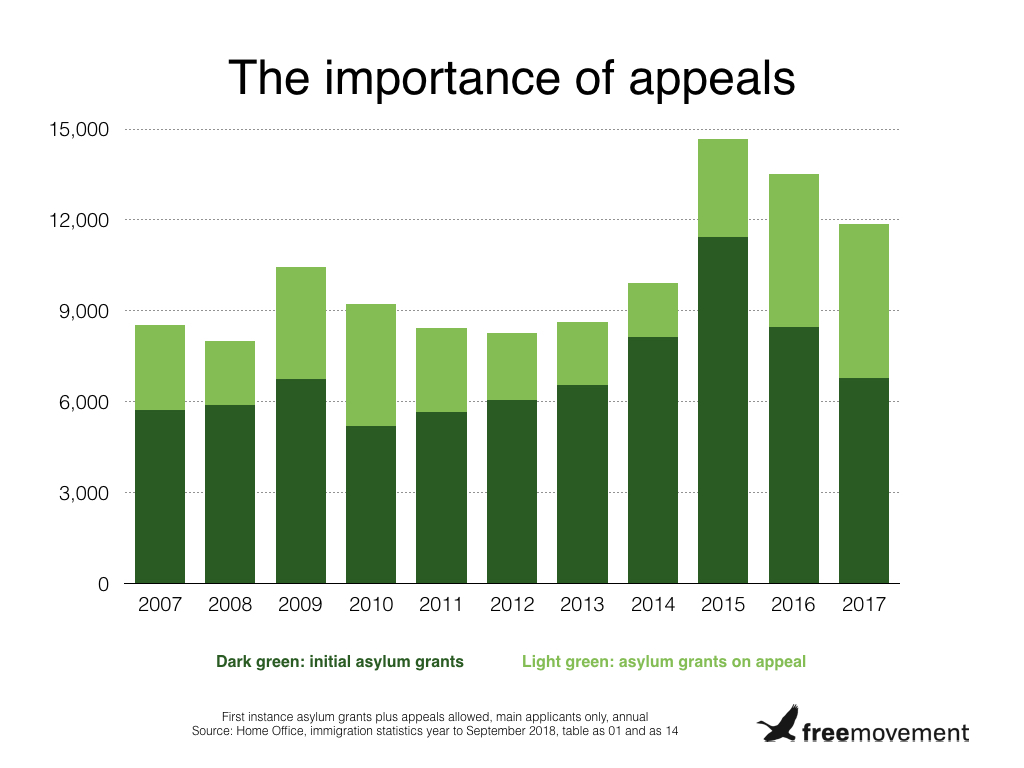
Appeals, decided by judges at the immigration tribunal, play a big role in the the asylum process. Between 35% and 40% of appeals are successful. Last year, 5,000 people successfully appealed against a Home Office decision to refuse them asylum.
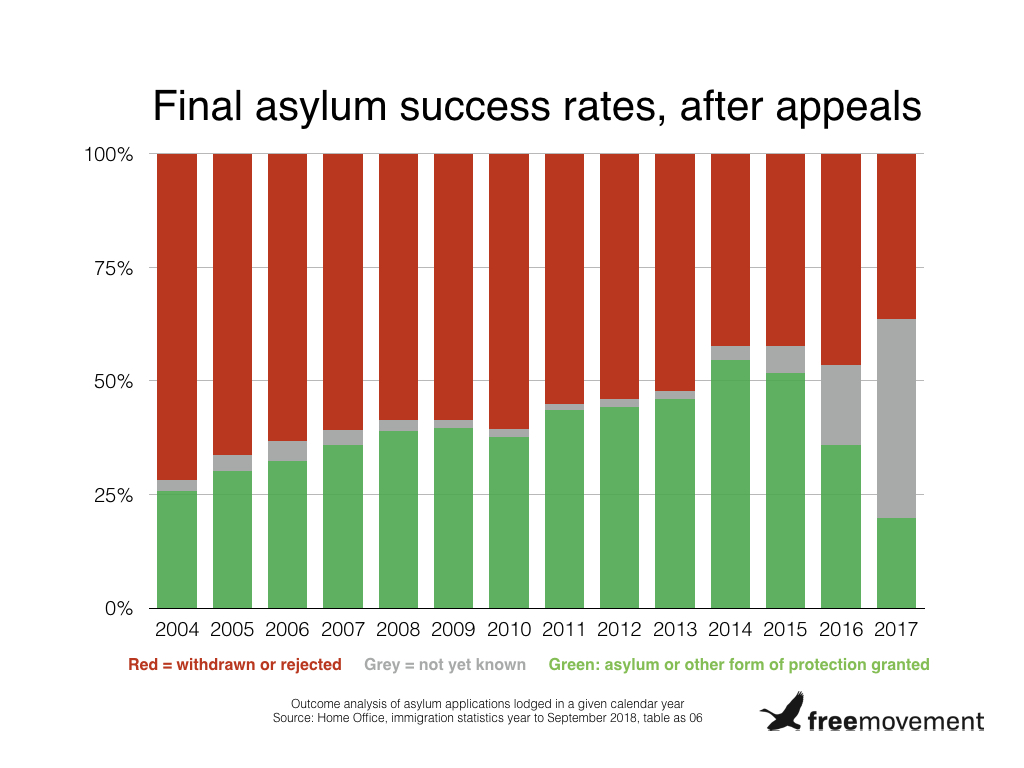
The proportion of asylum applications that are ultimately successful is rising, from consistently under one third a decade ago to over 40% in recent years. The chart below shows the final success rate in asylum applications, after appeals, with the most recent data necessarily contained a lot of grey to represent cases still under appeal.
Detention and returns
The number of people held in immigration detention has been falling recently. The chart below shows that at the end of the most recent quarter, there were just over 2,000 migrants in detention centres — a record low.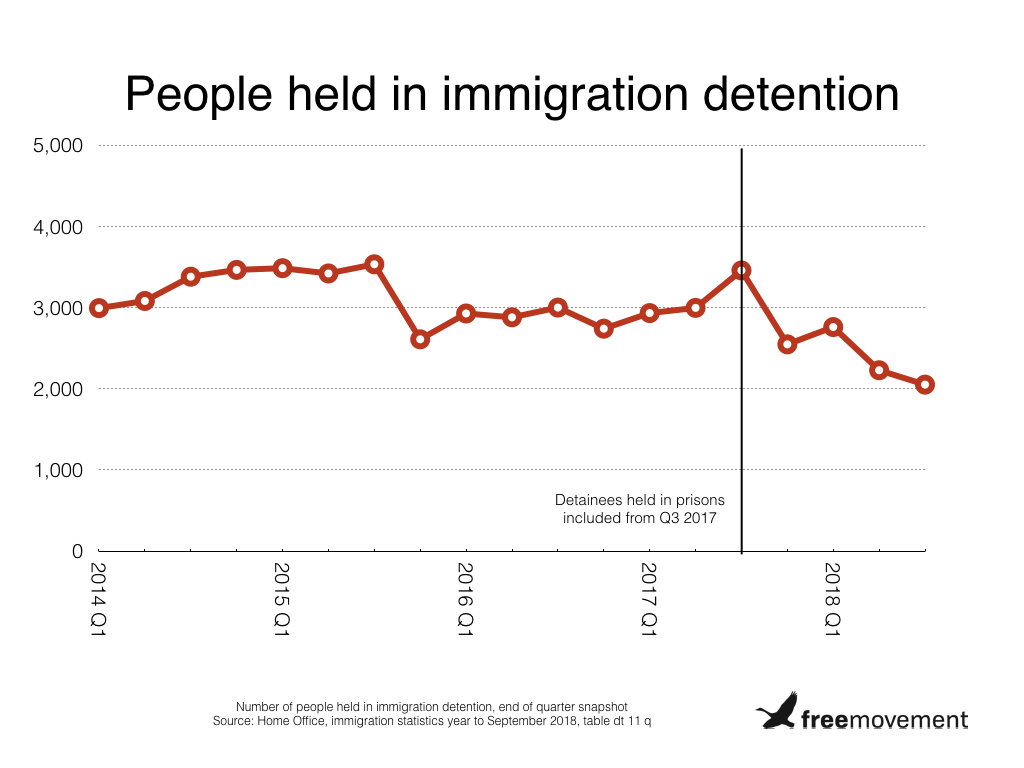
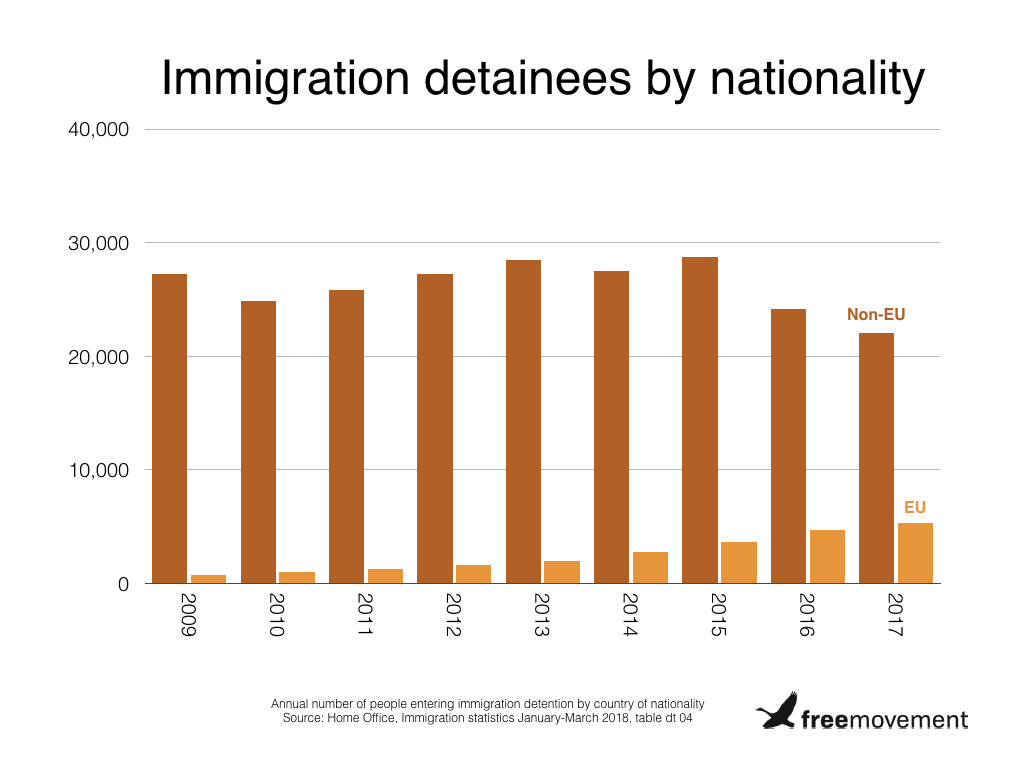
The above takes a snapshot of the number of people in detention on a given date. You can look at it in another way, by seeing how many people pass through detention centres each year. Here too the numbers are down, although not radically. Around 27,000 people entered detention over the course of 2017, less than a couple of years ago but more than in 2010. The picture is similar for the number of people recorded leaving detention.
A rising proportion of those are from the European Union: around a quarter last year. Although detention is supposed to be used where removal from the UK is imminent, fewer than half of migrants leaving detention are being removed. The majority are released on bail.
Migrants with no permission to be in the UK, or who have been deported for committing a crime, will be removed from the country by the Home Office. These removals, or “returns”, can be either voluntary or enforced. Either way, returns have seen a massive drop recently. The total number of migrants returned was just over 5,000 in the second quarter of 2018, the lowest by far since a new way of counting returns was introduced at the beginning of 2014.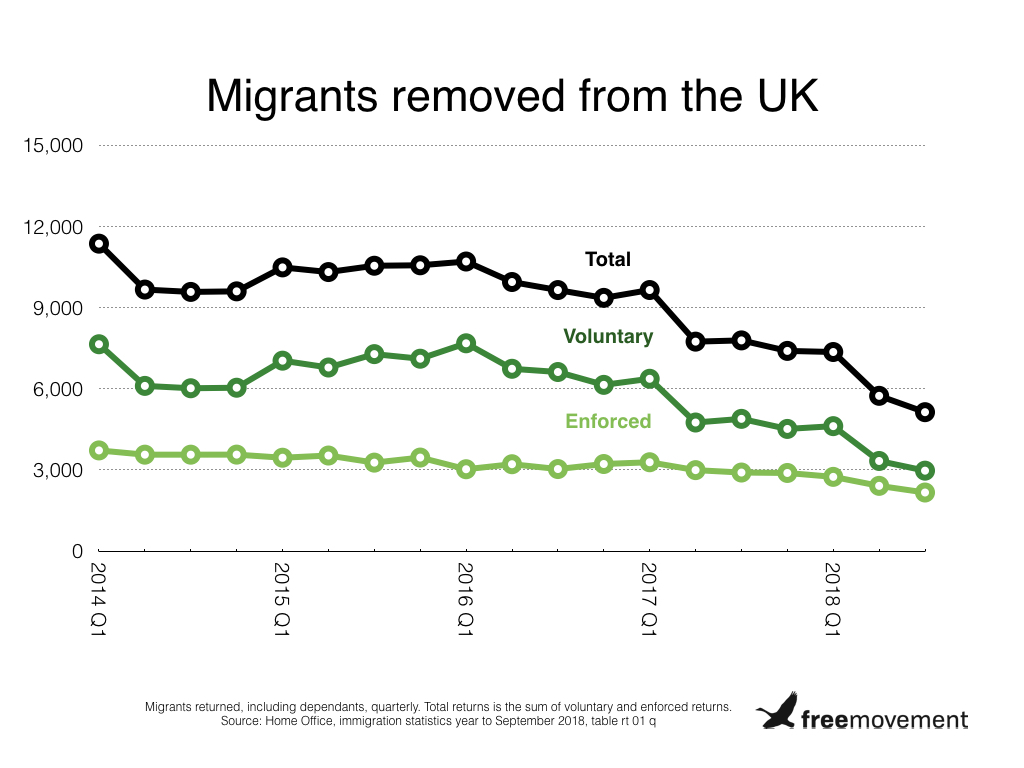
Business and study visas
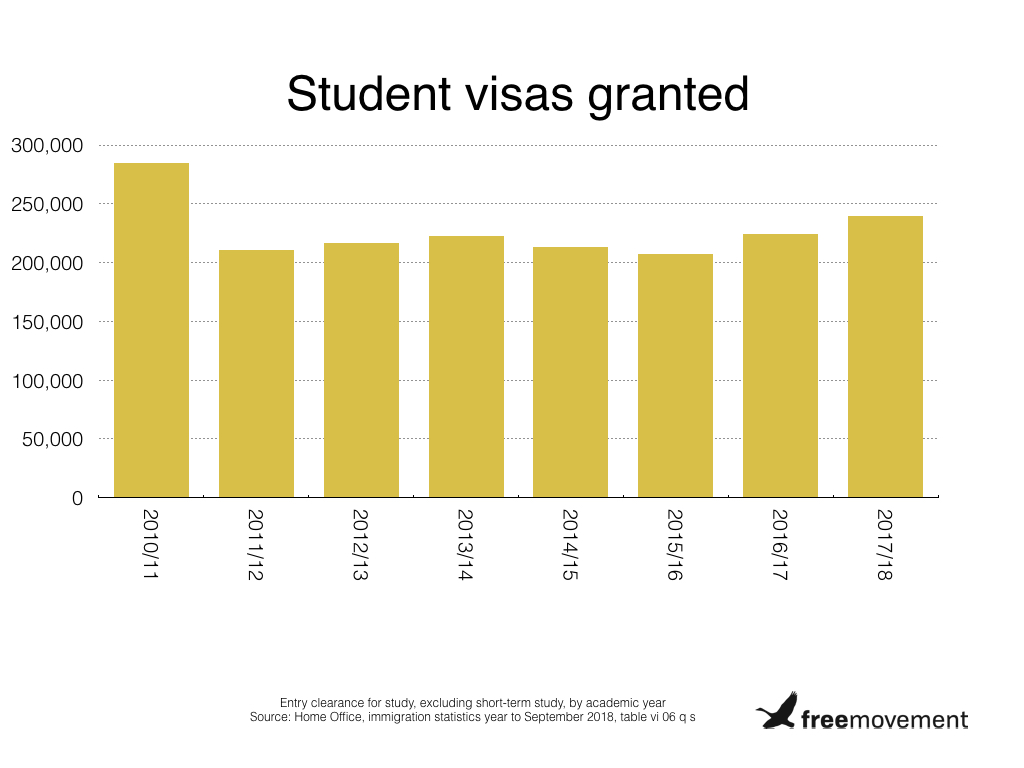
The number of student visas is staging a recovery, with visas for study in the UK rising 7% in the past year. The chart below excludes short-term study visas (which are also up).
The UK also grants various types of visa to non-EU workers, although these are tightly controlled. Perhaps the most prestigious and sought-after are “Tier 1” visas for investors and businessmen. Tier 1 visa holders do not need a sponsor to ply their trade in the UK.
The number of Tier 1 visas issued in the last three months is shown in the table below.
| Tier 1 visa type | Number granted, Q3 2018 | Change on previous quarter | Change on previous year |
| Investor | 96 | +4% | -16% |
| Entrepreneur | 296 | +11% | +30% |
| Gradaute entrepreneur | 53 | -39% | -9% |
| Exceptional talent | 170 | +38% | +47% |
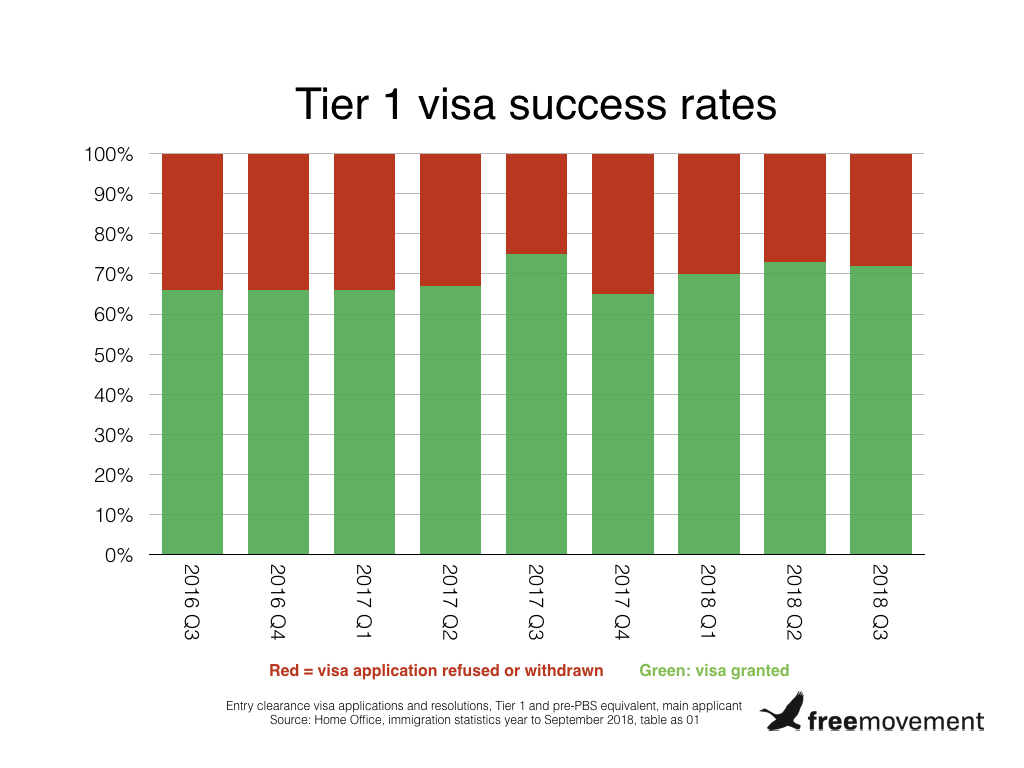
The success rate for these Tier 1 visas is quite high, and edging up in 2018 so far.
Appeals
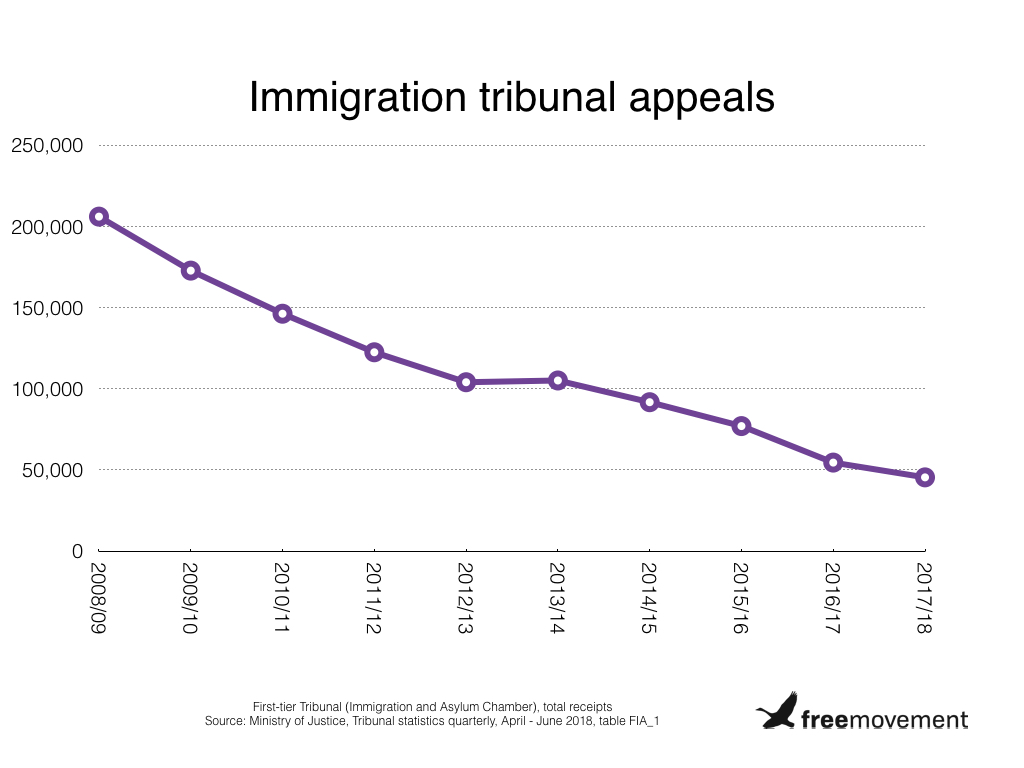
The number of appeals decided by judges at the First-tier Tribunal (Immigration and Asylum Chamber) has fallen significantly over the years, as the Home Office has stripped away rights of appeal against its decisions. The number of appeals received by the tribunal is now less than a quarter of the volume a decade ago.
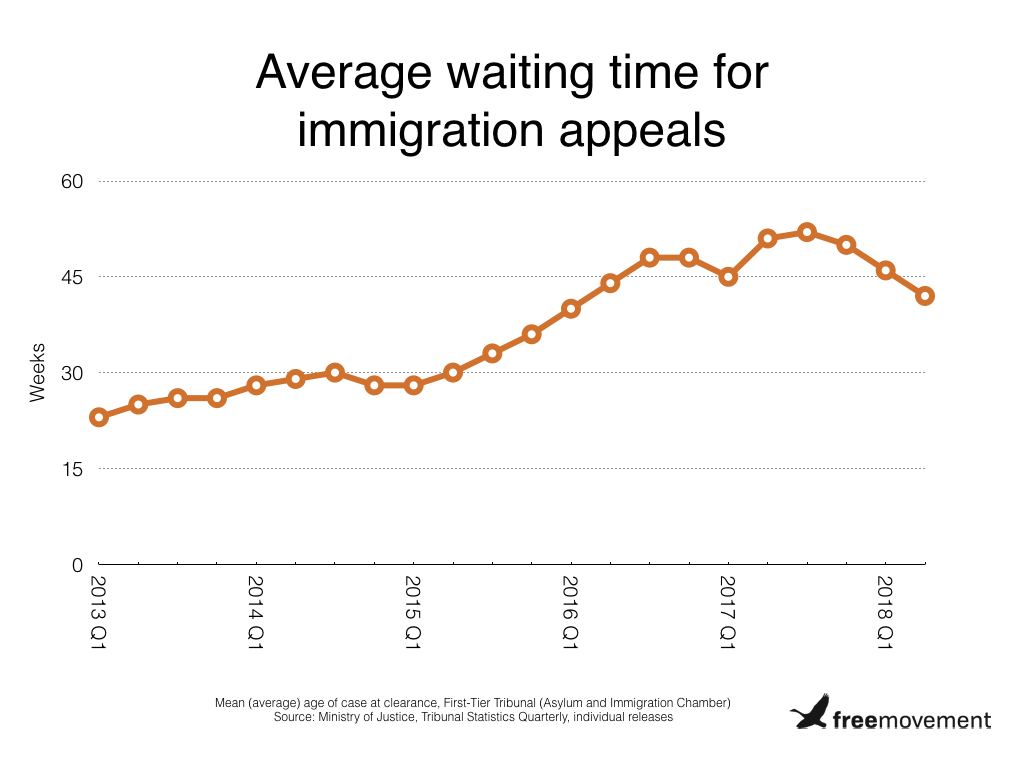
Despite the reduction in the number of appeals, the average waiting time for an appeal to be listed for hearing has until recently been rising. As of the second quarter of 2018, the average case takes 42 weeks to come before a judge.
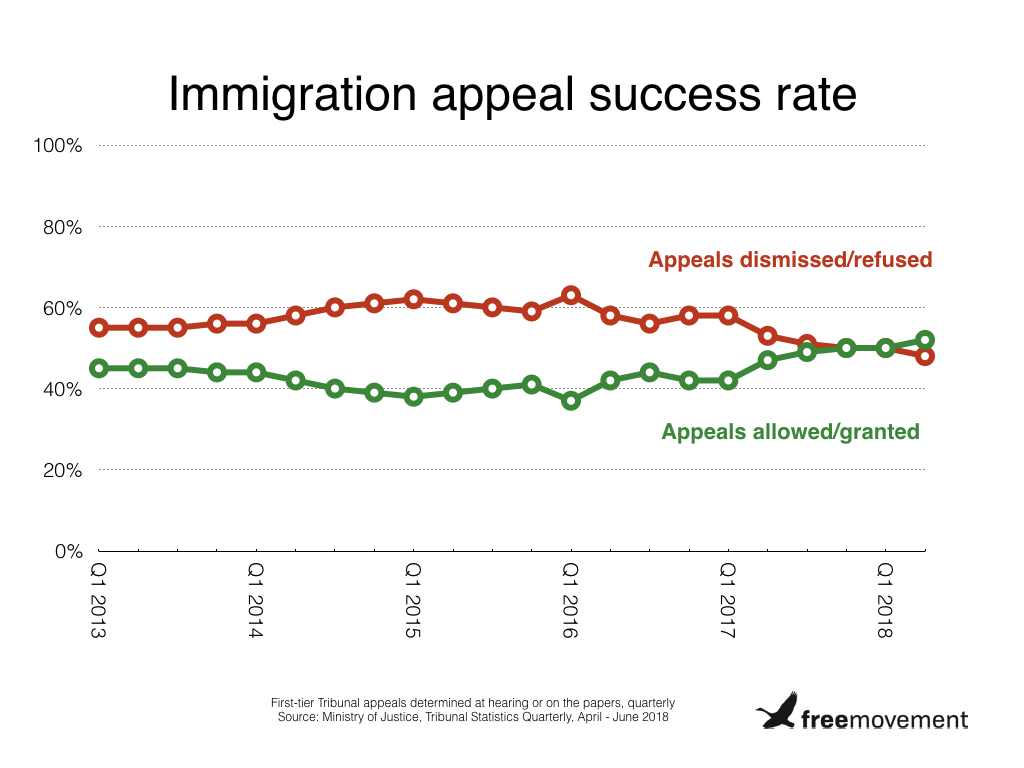
When appeals are finally heard, the Home Office loses around half of them. The success rate for migrants in their First-tier Tribunal appeals was 52% for cases heard between April and June 2018 — an all-time high.
