- BY Paul Erdunast

Latest immigration statistics published: EU exodus confirmed
THANKS FOR READING
Older content is locked

A great deal of time and effort goes into producing the information on Free Movement, become a member of Free Movement to get unlimited access to all articles, and much, much more
TAKE FREE MOVEMENT FURTHER
By becoming a member of Free Movement, you not only support the hard-work that goes into maintaining the website, but get access to premium features;
- Single login for personal use
- FREE downloads of Free Movement ebooks
- Access to all Free Movement blog content
- Access to all our online training materials
- Access to our busy forums
- Downloadable CPD certificates
The latest quarterly immigration statistics have been published. The headline is that net migration for the year ending March 2017 has reduced by almost a quarter, to 246,000 down from 327,000 in the year ending March 2016. The overall figure represents the lowest net migration figure since the year ending March 2014. This decrease is, I suppose, great news for arbitrary target setters and tabloid newspaper editors.
You can see the summaries and breakdowns by theme here and the ONS analysis here.
A deeper look at the statistics reveals that while most of the decrease is due to lower levels of immigration, much of it is fuelled by emigration, mostly by EU nationals. The overall emigration figure has increased by 31,000 overall. This change is almost entirely fuelled by EU citizens leaving the country: emigration from the UK by EU citizens has increased by 33,000 overall, while emigration by non-EU citizens has actually decreased, by 9,000, the remainder of the increase in overall emigration accounted for by British nationals. Immigration figures for non-EU nationals are also down – showing how great a job this country has done in turning into a place fewer want to be part of.
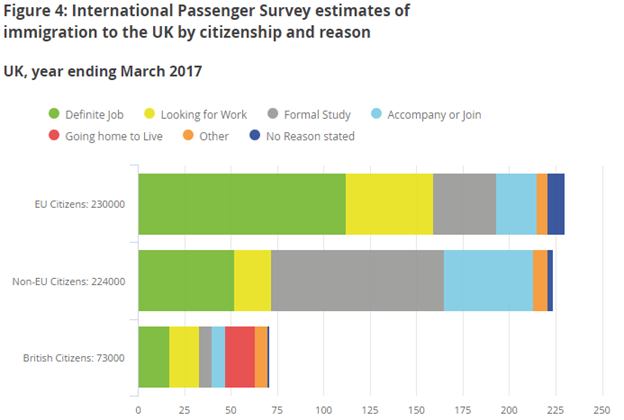
This helpful chart from the ONS shows the main reasons why EU citizens, non-EU citizens and British citizens immigrate. The proportion of EU nationals arriving in the UK either with a job or seeking work, and that of non-EU nationals arriving to study is striking.

Let us focus in on some specific areas, this time with data from the year ending June 2017:
Asylum
The total number of asylum applications for the first two quarters of 2017 is down significantly from last year’s figures: 12,688 from 16,119. Nonetheless, a total of 16,211 people were granted asylum in the year ending June 2016, up from 15,108 in the previous year. The top three countries of origin by number of applications were Iran (4,184), Pakistan (2,870) and Iraq (2,672).
The success rate at initial decision varied significantly by nationality: 37% of applications from Iranian nationals were accepted, by contrast with only 12% of Iraqi nationals.
EU applications
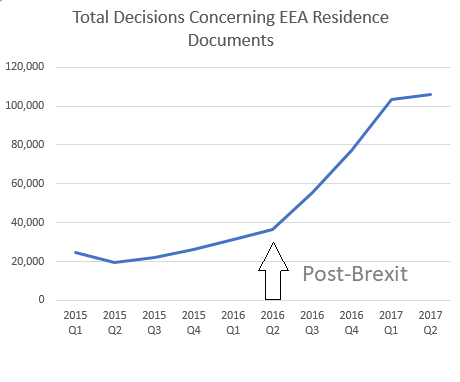
Unsurprisingly, since Brexit occurred the uncertainty concerning what documentation is required to stay in the UK has resulted in a stratospheric increase in applications for EEA residence documents. The table below documents the increase in decisions made concerning such applications over the past three years. Note the leap after Brexit was announced.

So the two trends in this area are an increase in applications for documentation, and, as noted above, an increase in EU nationals simply leaving the UK.
Work and Study
The number of Tier 2 visas was down by 1%; Tier 5 youth mobility and temporary visas were 4% down; and the overall number of work-related visas granted, including for dependants, was down by 2%. Nothing striking stands out here by comparison to other categories of migration.
Enforcement
Despite the Shaw Review into detention, the figures show that very little has changed regarding the frankly inordinate length of time people are detained.
Today's #detention stats shows many still remain detained for a long time. And absolutely no change since Shaw Review. #Time4aTimeLimit pic.twitter.com/eZC4r6ksV1
— TheDetentionForum (@DetentionForum) August 24, 2017
The total number of enforced removals has dropped marginally from 13,690 in the year ending June 2016 to 12,469 this year – the former number already being down on the 14,395 who were removed in the year ending June 2015.
